Harper Hughes · 8 October 2026
Wheel Dynamics in Pedestrian-Friendly Zone Infrastructure Projects
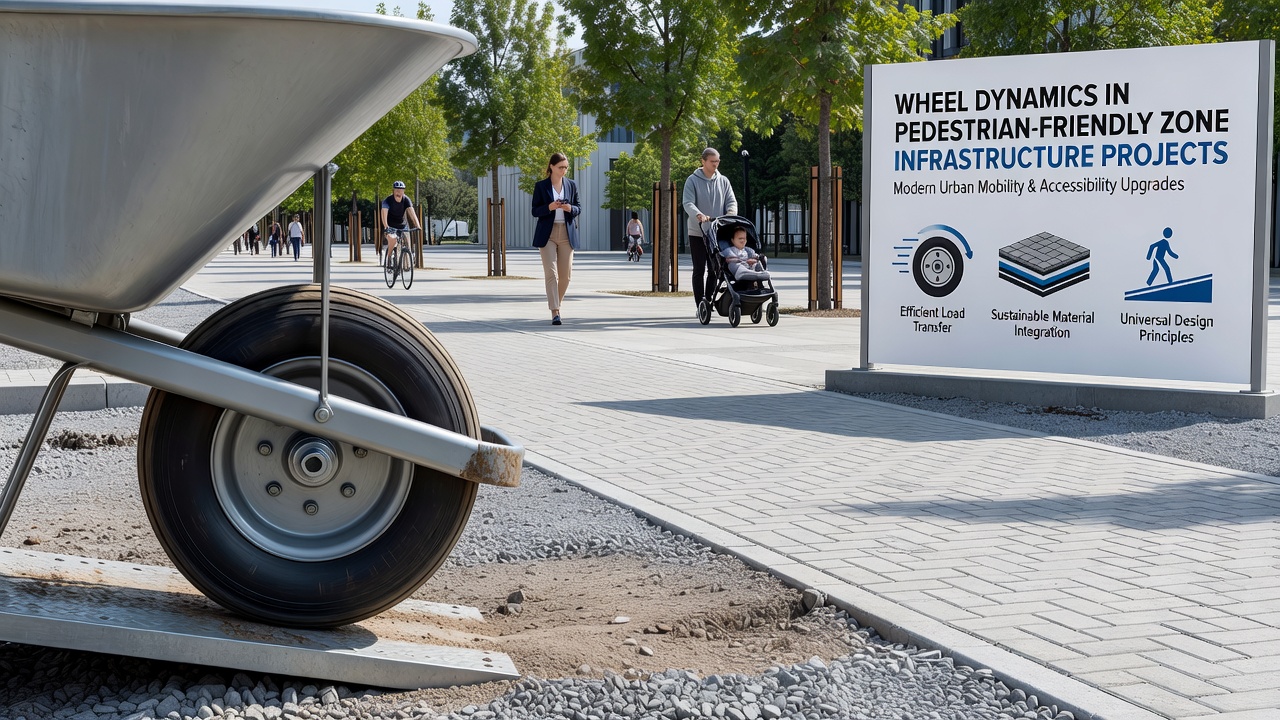
Wheel dynamics in pedestrian-friendly zone infrastructure projects involve the study of how various wheel types interact with surfaces designed primarily for foot traffic yet still accommodate delivery vehicles, service carts, and mobility aids, and researchers have examined friction coefficients, load transfer, and vibration transmission across multiple surface materials since the early 2010s. Cities have integrated these zones into downtown cores where planners must balance accessibility standards with durability requirements while data from municipal engineering reports indicate that surface irregularities can alter wheel contact forces by up to 35 percent depending on material composition and joint spacing.
Material Selection and Surface Performance
Engineers select paving materials such as textured concrete, resin-bound aggregates, and interlocking blocks because these options influence rolling resistance and lateral stability for wheels ranging from small caster types on delivery trolleys to larger tires on maintenance trucks, and studies conducted by transport research institutes show that porous asphalt reduces splash-back during rain while maintaining acceptable grip levels for both pedestrians and wheeled devices. In zones where daily vehicle passages exceed 200 units, surface wear patterns emerge faster on smoother finishes, which prompts crews to apply sealants at intervals of 18 to 24 months according to maintenance logs compiled by several North American municipalities.
Load Distribution and Structural Design
Design teams calculate expected axle loads and turning radii before specifying curb heights and drainage grate placements because concentrated wheel pressures near edges can exceed 2.5 times the nominal static weight when vehicles execute tight maneuvers, and finite element modeling software used by consulting firms demonstrates that reinforced sub-bases distribute these forces more evenly across the underlying soil layers. Observers note that pedestrian zones often incorporate raised crossings with chamfered transitions measuring between 8 and 12 millimeters to minimize jolts for wheelchair users while still allowing efficient passage for heavier equipment, and figures released by the European Road Transport Research Advisory Council in 2024 highlighted a 22 percent reduction in reported vibration complaints after such transitions were installed in pilot districts.
Case Examples from Recent Implementations
One project in Melbourne adjusted wheel path alignments along a 1.2-kilometer retail corridor by embedding colored aggregate strips that guided delivery drivers away from high-traffic pedestrian areas, and monitoring equipment recorded a measurable drop in surface scuffing within the first nine months of operation. Another initiative in Vancouver incorporated sensor-embedded pavers that logged wheel counts and peak pressure events, allowing planners to schedule resurfacing before visible deterioration appeared, while similar data collection efforts in Singapore have informed updates to national accessibility guidelines scheduled for release in October 2026. These examples illustrate how real-time feedback loops help refine initial design assumptions about wheel dynamics under mixed-use conditions.
Regulatory Frameworks and Measurement Standards
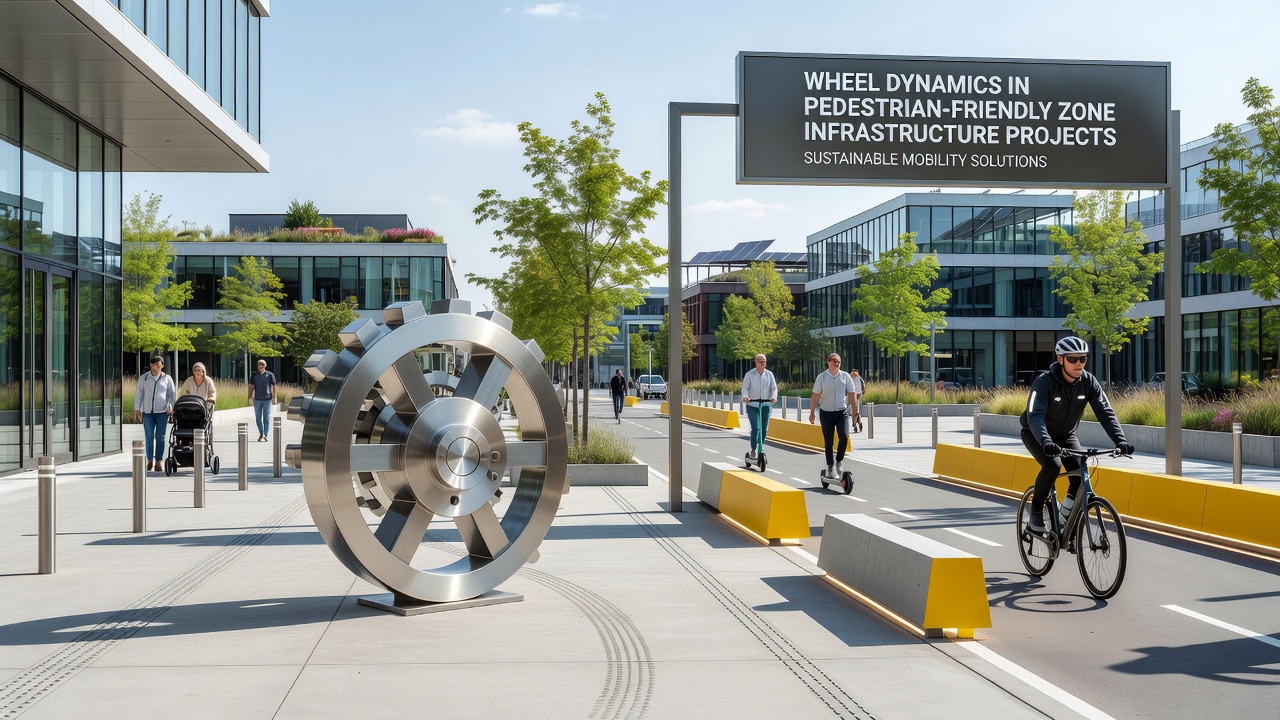
Authorities in multiple jurisdictions have established testing protocols that measure skid resistance using pendulum devices and record vertical deflection under standardized wheel loads, and Transport Canada documentation outlines procedures requiring minimum friction values of 0.45 for zones permitting motorized carts. Australian infrastructure guidelines recommend annual audits that compare pre- and post-installation vibration spectra collected from representative wheel types, while the results feed into asset management databases used by local councils to prioritize repairs. Compliance documentation often references ISO 10844 for surface texture characterization because consistent measurement methods enable cross-city comparisons of performance data collected over multi-year periods.
Integration with Emerging Technologies
Smart infrastructure elements such as embedded pressure mats and connected vehicle interfaces are beginning to appear in newer pedestrian zones, and these systems transmit wheel load information to traffic management centers that adjust temporary barriers or reroute service vehicles during peak pedestrian hours. Research teams at several universities have tested machine-learning models that predict surface degradation rates based on combined wheel count, weather, and material variables, with preliminary outputs suggesting maintenance intervals can be extended by 15 to 20 percent when predictions guide scheduling decisions. As cities prepare updates scheduled for October 2026, integration of these technologies is expected to become more widespread in districts that already track basic wheel dynamics metrics.
Conclusion
Wheel dynamics considerations continue to shape how pedestrian-friendly zones are planned, constructed, and maintained across diverse urban settings, and ongoing data collection supports iterative improvements to material specifications and geometric details. Municipal reports and international standards together provide the factual foundation for these projects, while emerging sensor technologies offer additional tools for monitoring performance over time. The field remains focused on measurable interactions between wheels and infrastructure rather than subjective preferences.